
With spring rapidly accelerating, now is the ideal time for a little spring migration review. But rather than focusing solely on identification, let’s look over some of what we know about migration itself, specifically its timing, its interaction with weather, and how to predict it. Being able to predict migration—of course within a margin of error—can amplify everything that makes spring migration exciting. Indeed, merely by visiting a few websites, you have the godlike power of knowing when to expect arrivals, influxes, and fallouts, and when the best time to get out there may be.
To get you started, here are five simple steps to help you become your own migration-forecasting guru:
Step #1 – Know what the atmosphere’s doing
For this, I use Intellicast’s Mixed Surface Analysis, which provides two handy pieces of information: 1) Where the frontal boundaries (fronts) and centers of air masses are, and 2) Where precipitation is happening. The atmosphere is composed of air masses, which can be rising, falling, warm and wet, cold and dry, and anything in between. These characteristics interact to make them behave either as low pressure systems or high pressure systems. Here’s the key thing to remember: low pressure systems rotate counterclockwise, while high pressure systems rotate clockwise. This means that when there’s a big “H” on the map, a high pressure center, the air is moving clockwise around it. The opposite is true for the big “L’s” on the map, low pressure centers around which air moves counterclockwise. This allows you to predict where winds will be favorable or unfavorable for migration before you’ve even checked the winds.
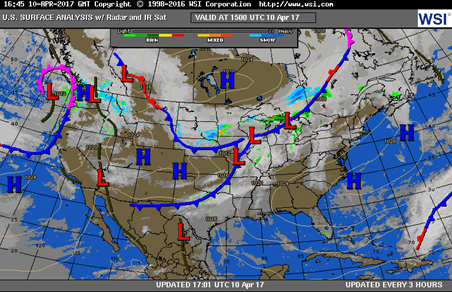
Having the fronts depicted brings another benefit: many migrants move ahead of or just behind fronts—if they’re going the right direction. Migrants seem to have a particular affinity for cold fronts, which tend to move faster. But if a front—and the precipitation it carries—is moving the opposite direction of migrants, they can cause migratory fallouts. Either way, keeping an eye on fronts can help you spot those critical moments when your favorite migrant traps will be the busiest with birds.
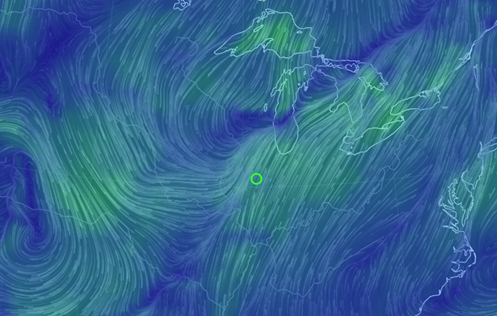
Step #2 – Focus on the winds
After you’ve ‘read’ the surface analysis map, take a look at a earth map only depicting wind. This is mostly to check your interpretation of the surface analysis map. Are the winds going the direction you predicted? The wind map should make it especially clear where conditions are favorable for migration: anywhere with southerly (from the south) winds has potential to facilitate spring movement. Tailwinds—southerly in the spring and northerly in the fall—are the name of the game, though don’t be surprised when there are exceptions! If you’re interested in forecasting migration further ahead of time than the night before, this Intellicast wind forecast is extremely useful.
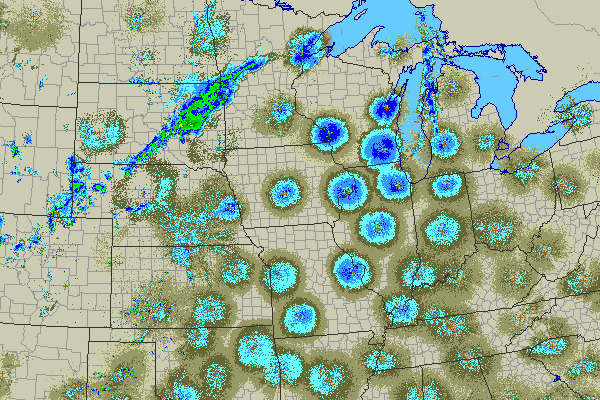
Step #3 – Check the radar
Now that you know where to expect migration, and why you’re expecting that migration, is there any migration? NEXRAD radar is exactly what you need to answer this question (Check out a map of the contiguous US or any of the 3-letter stations codes on the National Center for Atmospheric Research real-time weather data map). NEXRAD stations record images from numerous locations around the country, picking up anything made of water in the atmosphere. Most of the time, this just means clouds and storms systems. But because living things are also comprised largely of water, this means that in large enough numbers they show up on radar too. During the spring and fall, this is exactly what happens with birds, which show up as blue and/or green donut shaped forms on the radar. As the blue gets brighter and then goes green through the night, migration is getting heavier. Massive, mostly green orbs on the radar means extremely heavy migration, or, in other words, that you should probably go birding tomorrow morning.
Step #4 – Check eBird and BirdCast for what to expect
While radar tells us that migration is happening, it doesn’t tell us what’s migrating. For this, I use eBird frequency charts to predict which species are arriving and influxing based on what time of year it is. Scrolling through these charts can give you a good idea of which species will be most abundant tomorrow morning, and which species might just be arriving. Even better, these charts are a handy reminder of those species that you might have forgotten to look for. BirdCast, another Cornell Lab of Ornithology project, provides succinct, regional migration forecasts to enrich what you learn from eBird charts. If there’s anywhere online to visit for condensed migration information, BirdCast is the place.
Step #5 – Get out there!
Now that you know how to read a surface analysis map, how to interpret winds, how to track migration using radar, and how to keep track of which species are moving, you have the power to predict migration. You can predict when it’s happening, explain the weather behind why it’s happening, and even name which species should be part of the mix. All that’s left now, of course, is to go apply it in the field!
by Nick Minor